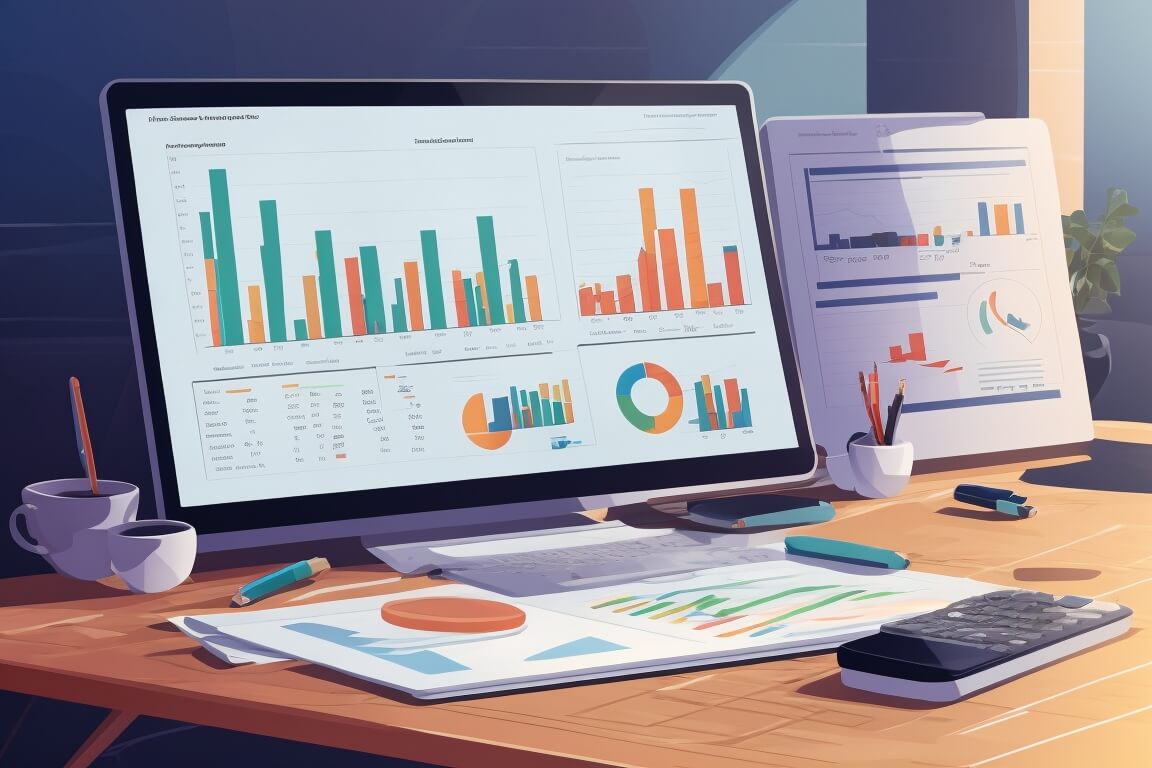
FinStatInsight Comprehensive Financial Dashboard:
In order to facilitate a thorough understanding of the group’s financial standing, we present a comprehensive financial dashboard analysis. This examination is underpinned by a detailed review of both quarterly and yearly financial data, complemented by trend charts that offer a visual representation of key financial indicators.
Quarterly & Yearly Financial Overview:
Revenue Trends: The analysis delves into the quarterly / yearly revenue figures, identifying patterns and fluctuations. Notable contributions from specific business segments or regions are highlighted.
Earnings Growth: An assessment of the quarterly / yearly earnings growth, considering factors such as investment initiatives, market conditions, and overall business strategy.
Cost Management: A close examination of cost of sales and administrative expenses, pinpointing any discernible shifts or improvements in management strategies.
Profitability Metrics: Key profitability indicators such as gross margin, operating margin, and net profit margin are scrutinized to gauge overall financial health.
Balance Sheet Analysis: A comprehensive review of the balance sheet, encompassing assets, liabilities, and equity. This section aims to provide insights into the group’s financial structure.
Cash Flow Dynamics: An analysis of cash flow trends, focusing on operating, investing, and financing activities. This sheds light on the group’s liquidity and capital allocation strategies.
Trend Charts:
Visual representations of key financial metrics over time each quarter and each year, aiding in the identification of trends, inflection points, and areas of strength or concern.
Sample of the Comprehensive Report
Feel free to view the LIVE example of the comprehensive financial report based on the actual financial data below.
Sample LIVE comprehensive dashboard
How much to get it ?
FREE
Yes, you saw it right. At the moment, we’ll give it for FREE with small favor from you. We just started establish FinStatInsight and we’d like your support. Please go to our instagram page and do these 4 steps:
- Follow our instagram @finstatinsight
- Look for our instagram post on the company financial insight which you’d like to get the financial dashboard.
- Comment on that instagram post by saying “I’d like to get the dashboard”.
- DM on our instagram by stating your email address and which company financial statement you’d like to get the comprehensive dashboard.
We’ll contact you to share the dashboard link. Straightfoward isn’t it?
Recognizing the value of your time, we have meticulously gathered and compiled the financial data quarter by quarter and year by year from companies’ released financial statements reports. This ready-made comprehensive report is designed to be a time-saving resource for you to get your choosen company’s fundamental analysis.
We aim to simplify and expedite your choosen company’s fundamental analysis. By consolidating the necessary data and providing insightful analyses, our goal is to empower you with a valuable resource that enhances your decision-making processes. This dashboard not only saves your time but also ensures that you have a better understanding of the company’s financial landscape for strategic planning and informed decision-making.
Summary:
This comprehensive financial dashboard analysis aims to equip stakeholders with a nuanced understanding of the group’s financial positions. By sharing both quarterly and yearly data alongside trend charts, this analysis seeks to provide a holistic view of the group’s financial performance, enabling informed decision-making and strategic planning.

