
⚓ Perdana Petroleum Berhad: Financial Performance and Strategic Positioning (YTD Q3 2025)
Introduction: Navigating a Period of Intra-Year Volatility
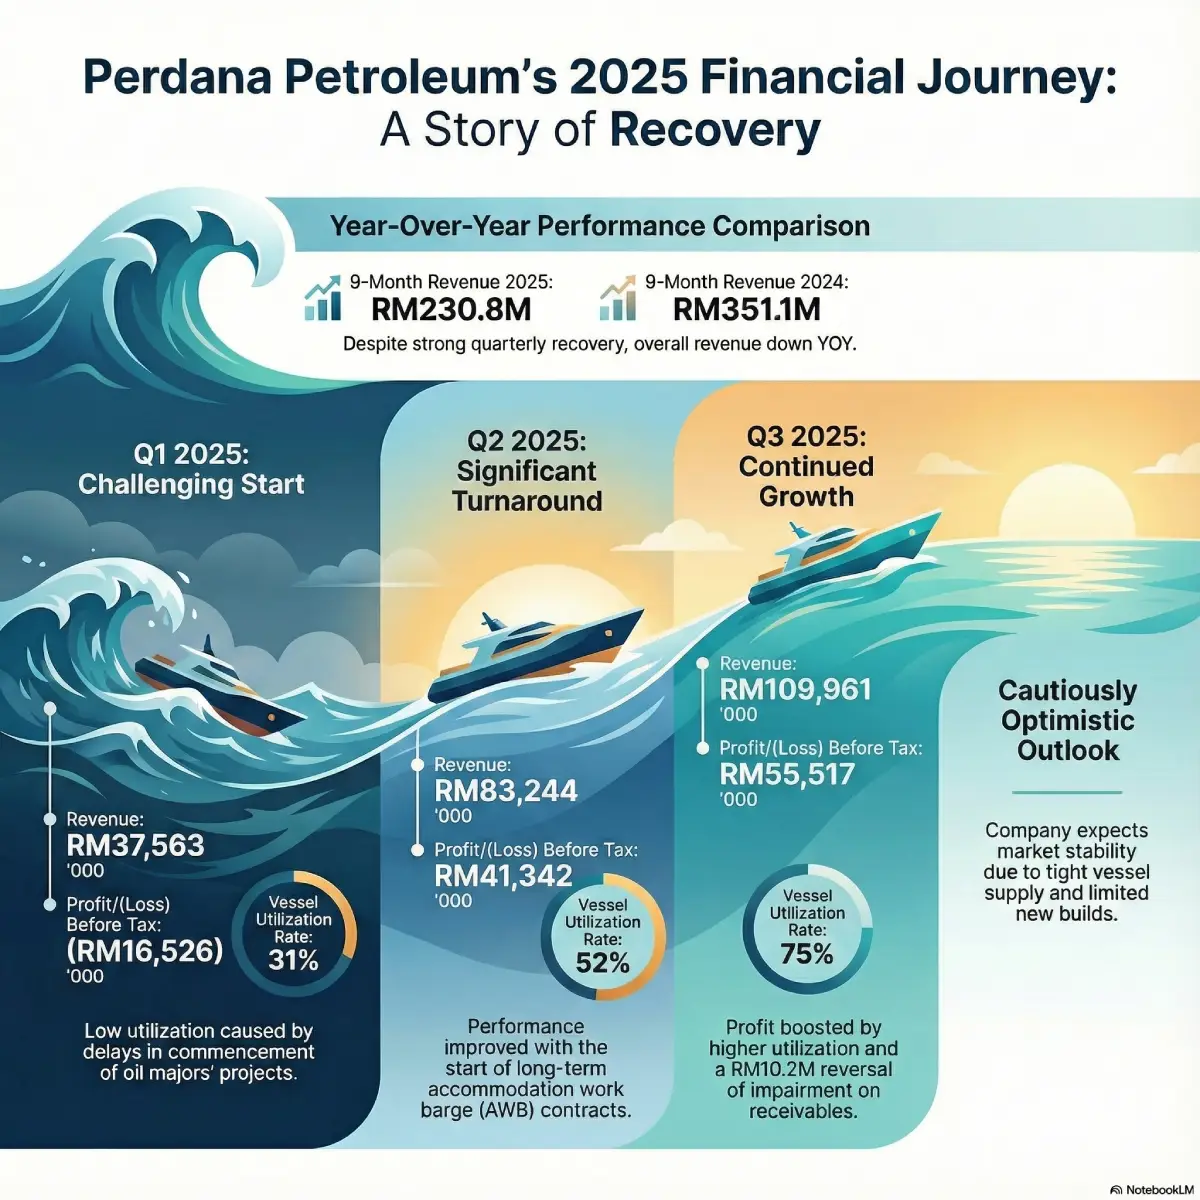
This report delivers a professional financial narrative analyzing the performance of Perdana Petroleum Berhad (the Group) for the first nine months of the fiscal year 2025 (9M 2025). The period under review was characterized by a significant intra-year operational and financial turnaround. Following a challenging start in the first quarter, the Perdana Petroleum Berhad Group demonstrated marked resilience, successfully returning to and sustaining robust profitability throughout the second and third quarters. Our analysis will deconstruct the core operational drivers underpinning this recovery, assess the material strengthening of the Group’s balance sheet, and evaluate its strategic placement within the current Offshore Support Vessel (OSV) market environment.

1. Nine-Month Performance Snapshot: Contraction vs. Prior Year
A year-over-year comparison for the nine-month period highlights a structural contraction against a strong 9M 2024 comparator. While the Group successfully maintained profitability, key financial metrics registered substantial declines, primarily due to lower operational utilization and a dramatic reduction in third-party chartering activities.
Consolidated Financial Summary (9M 2025 vs. 9M 2024)
| Financial Metric | 9M 2025 (RM'000) | 9M 2024 (RM'000) | Variance (%) |
|---|---|---|---|
| Revenue | 230,768 | 351,064 | (34%) |
| Gross Profit | 61,047 | 137,043 | (55%) |
| Profit Before Tax | 80,333 | 159,684 | (50%) |
| Profit After Tax | 57,903 | 116,576 | (50%) |
| Basic EPS (Sen) | 2.60 | 5.25 | (50%) |
The primary factors driving this year-over-year downturn were:
- Lower Average Vessel Utilization Rate (UR): A decrease to 53% from 76% in 9M 2024.
- Third-Party Chartering Decline: Income from this segment plummeted by approximately 60%, from RM96.9 million to RM39.3 million.
However, this consolidated view significantly obscures the powerful quarterly recovery that defined 2025, which is detailed in the subsequent sectional analysis.
2. Quarter-by-Quarter Analysis: The Intra-Year Turnaround
Sequential quarter-on-quarter analysis reveals the critical turning points and building operational momentum during 2025, providing a clearer view of underlying business health.
Q1 2025: Operational Headwinds
- The year commenced with significant challenges, registering a loss before tax of RM16.5 million on revenue of RM37.6 million.
- The underperformance was directly attributable to a severely depressed Vessel Utilisation Rate (UR) of only 31% (down from 62% in Q1 2024), linked to delays in project commencement by key oil majors.
- The decline was compounded by a sharp reduction in third-party chartering revenue, which fell to RM7.9 million from RM36.7 million in the corresponding period of 2024.
Q2 2025: A Resounding Return to Profitability
- Q2 marked a material financial recovery, posting a strong Profit Before Tax (PBT) of RM41.3 million on substantially improved revenue of RM83.2 million.
- Operational Improvement: Vessel UR rebounded sharply to 52%, driven by the successful deployment of long-term Accommodation Work Barge (AWB) contracts.
- Non-Operational Tailwinds: The bottom line was materially uplifted by a RM19.6 million net foreign exchange (forex) gain, largely unrealized, resulting from Malaysian Ringgit (MYR) appreciation against the US Dollar (USD). This non-operational item contributed nearly 47% of the quarter’s PBT, highlighting earnings volatility due to currency fluctuations.
Q3 2025: Sustained Operational Momentum
- The third quarter demonstrated continued strength, achieving a PBT of RM55.5 million on revenue of RM110.0 million.
- Core Operational Strength: Vessel UR reached a robust 75%, signifying effective fleet deployment and contract execution.
- One-Off Gain: Profitability was significantly bolstered by a non-recurring RM10.2 million reversal of impairment loss on receivables, following the successful settlement of long-outstanding dues. This one-off item does not reflect core operational performance.
- Stabilized Forex: In contrast to Q2, the forex impact was negligible, registering a marginal unrealized loss of RM0.3 million, reflecting currency stabilization and the disappearance of the prior quarter’s significant forex tailwind.
Key Quarterly Financial and Operational Metrics
| Metric | Q1 2025 (RM'000) | Q2 2025 (RM'000) | Q3 2025 (RM'000) |
|---|---|---|---|
| Revenue | 37,563 | 83,244 | 110,000 |
| Profit/(Loss) Before Tax | (16,526) | 41,342 | 55,517 |
| Vessel Utilisation Rate (UR) | 31% | 52% | 75% |

Analysis of Q3 Normalized Earnings (New Section)
To accurately assess the underlying operational profitability and momentum in Q3 2025, it is crucial to isolate the impact of non-recurring and non-operational items.
The reported Profit Before Tax (PBT) for Q3 was RM55.5 million. Normalizing this figure involves adjusting for the two primary non-core items:
- Impairment Reversal: RM10.2 million (Non-recurring gain)
- Foreign Exchange Impact: RM0.3 million loss (Non-operational item)
| Metric | Q3 2025 (RM'000) |
|---|---|
| Reported Profit Before Tax (PBT) | 55,517 |
| Less: Reversal of Impairment Loss | (10,200) |
| Add: Foreign Exchange Loss | 300 |
| Normalized Operating PBT | 45,617 |
The Normalized Operating PBT of RM45.6 million provides a clearer picture of the earnings power generated purely by core business activities (chartering and services) during the quarter. While this normalized figure is lower than the reported PBT, it still represents a substantial improvement over the Q2 normalized figure (RM41.3 million PBT - RM19.6 million Forex Gain = RM21.7 million normalized PBT), confirming the continued and accelerating strength of the Group’s operational recovery in Q3.
3. Analysis of Key Performance Drivers
3.1. Vessel Utilisation Rate: The Core Revenue Engine
The Vessel Utilisation Rate is unequivocally the most critical operational metric. The clear and direct correlation between UR and quarterly profitability (31% in Q1, 52% in Q2, 75% in Q3) demonstrates that the Group’s financial health is fundamentally driven by its ability to secure and execute contracts effectively.
3.2. Revenue Composition and Volatility
- Third-Party Chartering Volatility: While income from the Group’s proprietary fleet recovered strongly, the third-party chartering segment proved highly volatile. The significant year-over-year contraction was attributed by management to a scarcity of suitable third-party vessels, many of which had been relocated internationally in pursuit of more favorable daily charter rates.
- Resilience of Ancillary Services: Ancillary income streams, such as catering and mobilisation services, provided a growing and resilient counter-trend, indicating a positive operational dynamic beyond core chartering.
3.3. Impact of Non-Operational Financial Items
Reported profits were materially influenced by non-operational factors, introducing a degree of volatility:
- Foreign Exchange Fluctuations: Net forex impacts shifted dramatically: a RM3.3 million gain in Q1, a substantial RM19.6 million gain in Q2, followed by a marginal RM0.3 million loss in Q3.
- Non-Recurring Impairment Reversal: The RM10.2 million impairment reversal in Q3 provided a one-off, material boost to that quarter’s earnings, which should be normalized when assessing core operational profitability (as demonstrated above).
The Group’s operational recovery was robust, but the reported magnitude of its bottom line was heavily amplified or mitigated by these volatile non-operational events.
4. Financial Health: Balance Sheet Fortification and Cash Flow
Assessment of the balance sheet reveals significant financial de-risking and disciplined capital management, underscoring the Group’s long-term stability.
4.1. Aggressive Deleveraging and Balance Sheet Strength
The most notable financial development is the dramatic reduction in outstanding debt, strategically executed to fortify the balance sheet.
| Borrowings | As at Dec 31, 2024 (RM'000) | As at Sep 30, 2025 (RM'000) |
|---|---|---|
| Total Borrowings | 16,259 | 80 |
4.2. Robust Cash Flow Generation
Cash flow performance for the nine months demonstrates the core business’s strong ability to generate self-sustaining capital:
- Net Cash from Operating Activities: A strong inflow of RM121.7 million.
- Capital Allocation: Operating cash flows successfully covered both Net Cash Used in Investing Activities (RM34.8 million for CAPEX) and Net Cash Used in Financing Activities (RM46.9 million, primarily for debt repayment).
The strong operating cash flow adequately funded both capital expenditure and the significant deleveraging effort, validating a self-sustaining financial model.
4.3. Analysis of Deleveraging and Financial Flexibility
The Group’s decisive strategy to eliminate term loans has profoundly altered its financial structure, significantly enhancing stability and financial flexibility. This is clearly reflected in the evolution of its key leverage metrics.
Borrowings and Leverage Evolution
| Metric | As at Dec 31, 2024 (RM'000) | As at Sep 30, 2025 (RM'000) |
|---|---|---|
| Total Borrowings (A) | 16,259 | 80 |
| Total Equity (B) | 785,400 | 784,600 |
| Debt-to-Equity Ratio (A/B) | 0.021:1 | <0.001:1 |
- Near-Zero Debt-to-Equity: The ratio has effectively fallen to near zero ($<0.001:1$), marking the Group as virtually unleveraged as of the end of Q3 2025. This exceptional position insulates the business from interest rate risks and provides maximum resilience against market downturns.
- Strategic Positioning: This fortified balance sheet provides a significant competitive advantage, offering the Group substantial “dry powder” and capacity to pursue strategic opportunities—such as fleet renewal, major maintenance, or targeted acquisitions—without the immediate need to secure costly new financing. This aggressive deleveraging fundamentally de-risks the business model.
5. Summary Comparison: Operational Trajectory Q1 to Q3 2025
The following table synthesizes the journey from the operational challenges of Q1 to the sustained operational strength of Q3 by contrasting key metrics, particularly the shift from reported PBT to Normalized Operating PBT:
| Metric | Q1 2025 | Q2 2025 | Q3 2025 |
|---|---|---|---|
| Vessel Utilisation Rate (UR) | 31% (Lowest) | 52% (Rebound) | 75% (Highest) |
| Reported Profit Before Tax (PBT) | (RM16.5M) Loss | RM41.3M Profit | RM55.5M Profit |
| Key Non-Core Item | Minor Forex Gain | RM19.6M Forex Gain | RM10.2M Impairment Reversal |
| Normalized Operating PBT | (RM19.8M) Loss | RM21.7M Profit | RM45.6M Profit |
| Operational Conclusion | Weak activity, operational loss. | Significant operational recovery, but bottom line highly amplified by forex. | Strong operational momentum, core profitability accelerates. |
Key Insight: While Q2’s reported PBT was heavily influenced by currency gains, the Normalized Operating PBT trend confirms that the core business delivered a powerful, non-volatile operational acceleration through Q2 and Q3. The Group successfully moved from an operational loss of approximately RM19.8 million in Q1 to a robust operating profit of RM45.6 million in Q3, demonstrating successful execution of its turnaround strategy.
6. Market Outlook and Strategic Positioning
6.1. Market Environment
- Global Oil: The Group acknowledges a stable but complex global oil market, citing EIA forecasts for Brent crude averaging around USD69/bbl in 2025. Management remains vigilant regarding geopolitical risks (Middle East) and trade relations.
- Domestic Foundation: The domestic market outlook is stable, supported by PETRONAS’ reaffirmed commitment to upstream activities, which is expected to underpin sustained demand for local OSV services.
6.2. OSV Sector Dynamics and Strategy
A key positive structural factor is the constrained vessel supply, with a limited number of newbuilds entering the market. This structural cushion is expected to prevent sector oversupply and support long-term stability.
The Group’s forward strategy is explicitly focused on:
- Operational Discipline
- Cost Optimisation
- Fleet Efficiency
Management remains “cautiously optimistic,” aiming to capitalize on internal operational strengths and the favorable supply-side dynamics of the OSV sector to sustain long-term competitive positioning.
About Perdana Petroleum Berhad
Perdana Petroleum is a marine services company that supports offshore oil & gas operations through its fleet of vessels.
✅ What the company does
- Perdana Petroleum provides offshore marine support services for the upstream oil & gas industry — both in Malaysia and in regional markets.
- It owns and operates a fleet of vessels, including Anchor Handling Tug Supply (AHTS) vessels, accommodation workboats (WB) and workbarges (AWB).
- Its services include: accommodation and support for offshore personnel, towing/mooring/anchoring of barges and rigs, transportation of drilling/production/project materials and chemicals, and services to support exploration, development, installation, hook-up & commissioning, production, operations and maintenance offshore.
- It also may engage in leasing, and shipping/shipping‑related investments.
📍 Location / Headquarters & Contact Info
- The corporate headquarters is located at Level 18, Block 2, VSQ @ PJCC, Jalan Utara, 46200 Petaling Jaya, Selangor, Malaysia.
- The company also has presence/offices in Miri and Labuan.
📈 When it was listed on Bursa & Listing History
- Perdana was originally listed under the name Petra Perdana Berhad in 16-Aug-2000.
- The company changed its name from Petra Perdana Berhad to Perdana Petroleum Berhad in July 2011.
- Sector: Energy, Infrastructure, Equipment & Services
- Main Market